
The Triangulation Trap


At some point, someone hands you a loss triangle. Maybe it’s your actuarial consultant. Maybe it’s a carrier asking questions about your book. Maybe you built it yourself from a template you found online. Either way, you’re now staring at a grid of numbers that supposedly tells you something important about where your losses are headed.
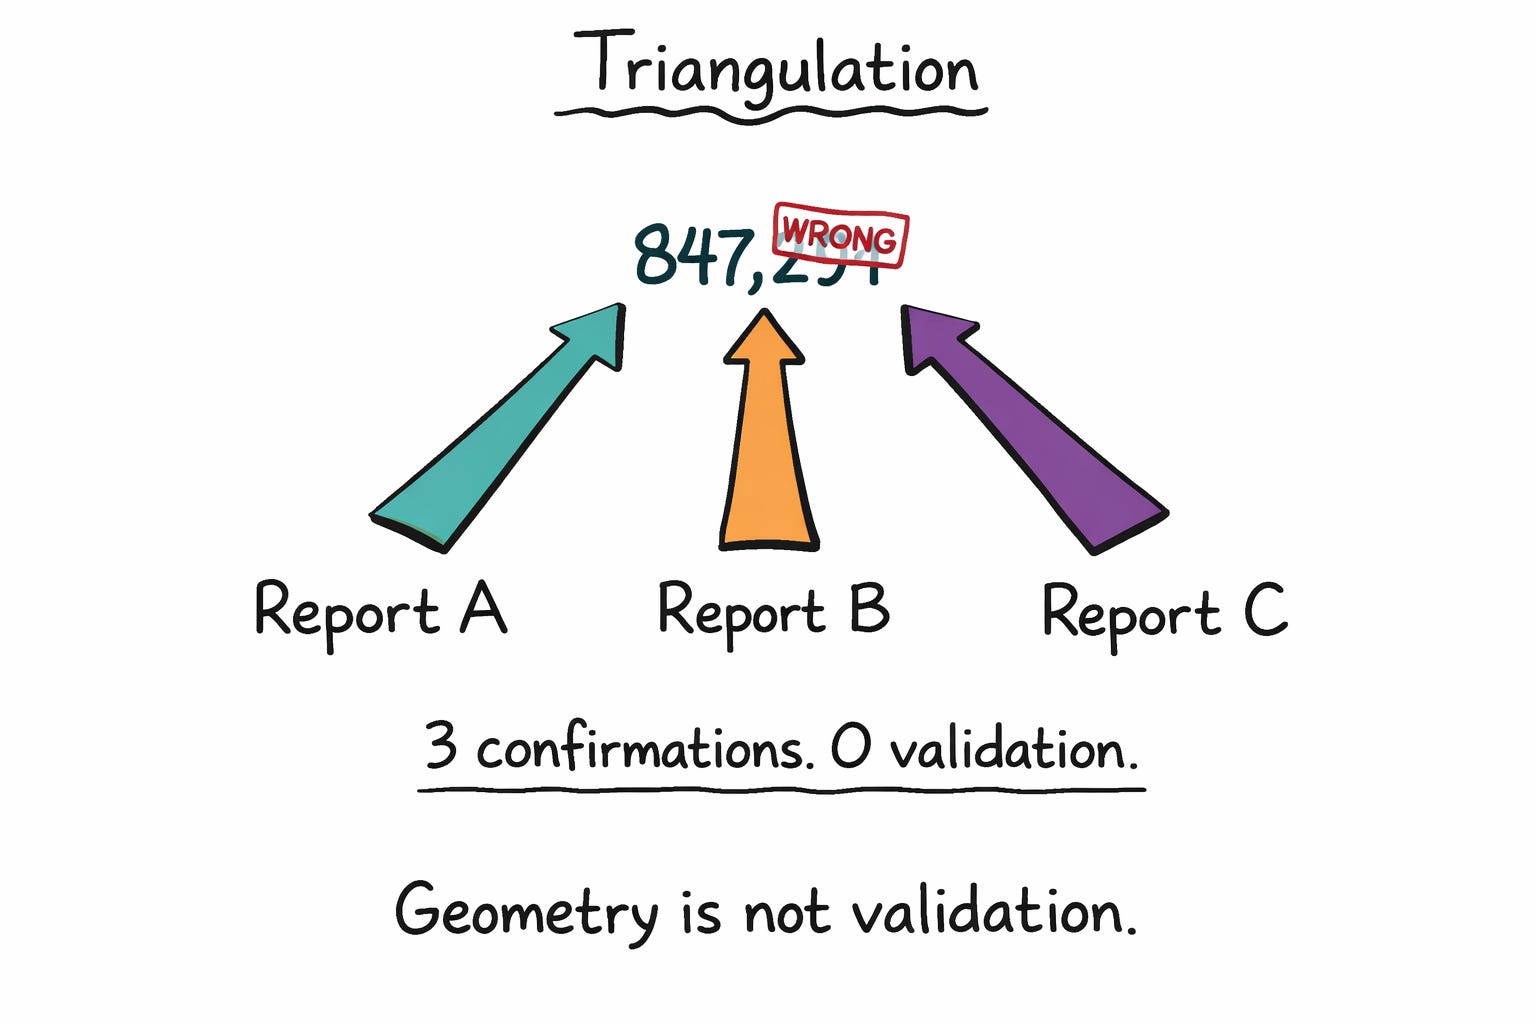
The triangle looks authoritative. It has a structure. There’s math involved. Development factors emerge from the data, projections get calculated, and suddenly you have an estimate for ultimate losses that feels more rigorous than whatever you were doing before.
Here’s the problem: The triangle can’t tell the truth yet. Not because the math is wrong, but because you don’t have the data to make it tell the truth.

What a Loss Triangle Actually Is
Before we get to the traps, let’s make sure we’re talking about the same thing.
A loss triangle is a way of organizing historical loss data to observe how claims develop over time. The rows are typically accident periods—usually years or quarters when losses occurred. The columns are development periods—how much time has passed since the accident period. Each cell shows cumulative losses as of that point in time.
The insight behind triangles is simple: losses don’t stand still. A claim reported in 2022 might be open for years. Reserves get set, then adjusted. New information emerges. Cases settle for more or less than expected. If you only looked at incurred losses as of today, you’d undercount every recent period because those losses haven’t finished developing.
Triangles let you watch older accident years mature to completion, observe the pattern of development, and apply that pattern to younger years that are still moving. If losses in year one typically grow by 20% between month 12 and month 24, you can apply that factor to your current year-one losses and estimate where they’ll land.
This is the foundation of loss development, and it underpins many IBNR (incurred but not reported) approaches usually combined with other reserving techniques. The technique has been used by actuaries for decades because it works—when you have the right data.
Why This Matters for MGAs
You might think loss triangles are a carrier problem. They’re the ones holding the risk long-term, setting reserves, worrying about adequacy. You’re just originating business.
This undersells your exposure.
First, carriers use triangles to evaluate you. When they’re deciding whether to renew your capacity or adjust your commission, they’re looking at how your losses develop. If your historical development has been adverse—meaning losses got worse over time—that factors into their pricing. If you don’t understand your own development patterns, you can’t anticipate their concerns or push back when their analysis is wrong.
Second, your IBNR isn’t a guess. Or at least, it shouldn’t be. When you report reserves, there’s supposed to be a methodology. “We think there’s more coming, so we added a buffer” isn’t a methodology. Triangles provide structure for estimating what’s still in the pipeline. If you’re not building them, someone else is—and you’re outsourcing a judgment about your own book to people who know it less well than you do.
Third, loss development is where underwriting success or failure actually shows up. You might think a program year was profitable based on early returns, then watch it deteriorate as claims develop. The triangle is the early warning system—if you know how to read it.

The Trap: You Don’t Have Enough Data
Here’s where MGAs get burned.
Triangles work best when there’s enough volume, decades of history, and thousands of claims per accident year. The math works because the volume smooths out noise. Any individual claim is unpredictable, but the aggregate develops in stable patterns. The factors derived from historical data are credible because they’re built on large samples.
Now look at your book. Maybe you have three years of history. Maybe you have 200 claims total, spread across those years. Maybe your oldest accident year—the one that’s supposed to be “fully developed” and anchor your factors—has 40 claims in it.
The development factors that emerge from this data are not stable. They’re artifacts of small samples. One large claim settling differently changes the factor. One unusual year throws off the whole pattern. You calculate a 12-to-24-month factor of 1.35, but the confidence interval around that number is enormous. It could just as easily be 1.15 or 1.55.
When you apply that shaky factor to your latest accident year and project ultimate losses, you’re not forecasting—you’re extrapolating from noise. The triangle gives you a number with false precision. It looks like an answer, but it’s not.
This is the first trap: treating thin data like it’s thick data. The math doesn’t care how many claims you have. It’ll calculate factors regardless. It’s your job to know when those factors mean something and when they’re just arithmetic on inadequate inputs.
The Second Trap: Mixing Things That Shouldn’t Be Mixed
Even if you have reasonable volume, triangles fail when the underlying data isn’t homogeneous.
Different lines of business develop differently. Workers’ comp has long tails—claims stay open for years, medical costs escalate, litigation drags. Commercial auto is shorter-tailed but volatile. General liability varies wildly depending on the coverage and the venue. If you build one triangle that combines all your lines, the development pattern is an average of things that don’t average.
Geography matters too. A liability claim in Florida develops differently than one in Ohio. Venue, plaintiff bar activity, judicial attitudes—all of this affects how long claims stay open and how they settle. A book concentrated in litigious states will show different development than the same book in friendlier jurisdictions.
Product mix shifts break triangles. If your 2021 book was mostly low-severity accounts and your 2023 book has larger, more complex risks, the historical pattern doesn’t apply. You’re not writing the same business, so why would losses develop the same way?
The triangle doesn’t know any of this. It sees numbers. It calculates factors. The output looks smooth, but underneath, you’ve blended segments with genuinely different development characteristics. The factors are compromises that don’t accurately describe any of the underlying pieces.
The Third Trap: Staring at the Factors, Ignoring the Story
Development factors are outputs. They tell you that losses grew by some percentage between two points in time. What they don’t tell you is why.
This matters because “why” determines whether the pattern will continue.
Maybe your 12-to-24-month development is driven by case reserve strengthening. Adjusters get more information, revise their estimates upward. That’s a normal pattern that will probably repeat.
Maybe it’s driven by late reporting. Claims that occurred in the accident year didn’t hit your system until later. That’s also normal, but the pattern depends on your reporting pipelines staying consistent.
Maybe it’s driven by litigation. A subset of claims went to suit, and the reserve jumps reflected legal exposure. That’s a different story—it depends on the litigation environment, your defense strategy, and factors external to your book.
Maybe it’s driven by one large claim that blew up. That’s not a pattern at all—it’s an event. Applying that factor to future years assumes the event will repeat, which is probably wrong.
If you don’t know what’s causing development, you can’t assess whether the factors are predictive. You’re pattern-matching without understanding. The triangle becomes a ritual—you calculate the numbers because that’s what you’re supposed to do, but you’re not learning anything about your business.
Why the Traps Persist
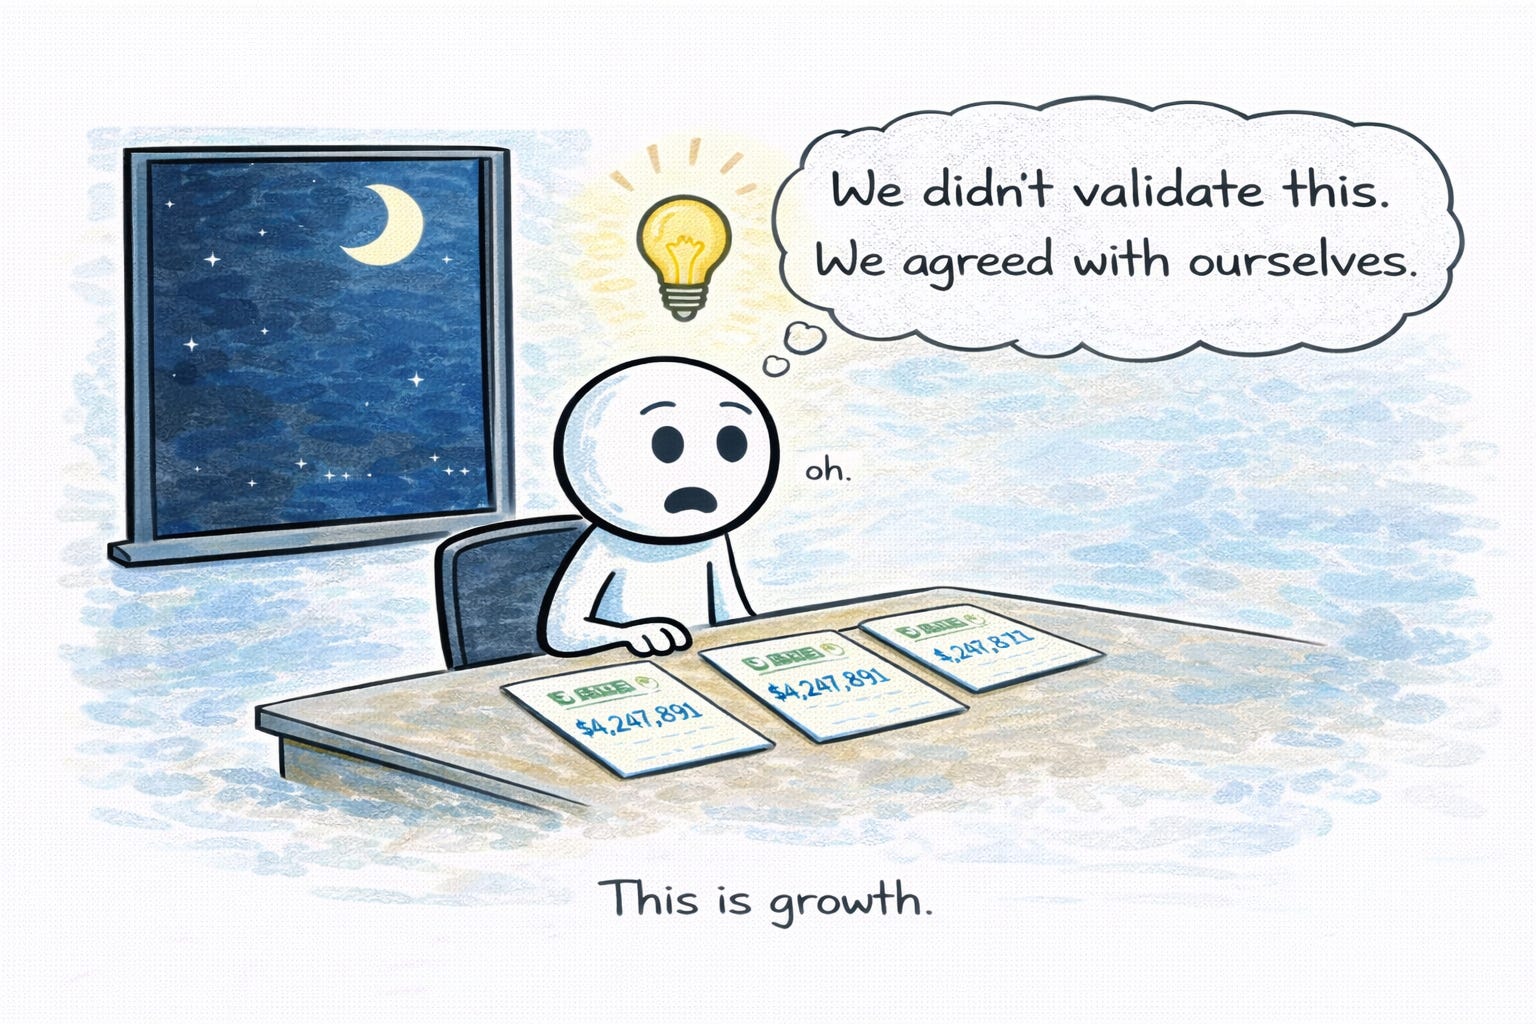
None of these traps are hidden. Anyone who looks hard at their data can see the volume isn’t there, the segments are mixed, the factors aren’t explained. Yet MGAs keep building triangles and treating the output as meaningful.
The reason is psychological, not technical. Uncertainty is uncomfortable. Leaders want a single number. Confidence gets rewarded more than clarity. The triangle provides the feeling of rigor—a structured answer that ends the conversation. It resolves anxiety, not ambiguity.
What to Do Instead
None of this means you should abandon triangles. It means you should use them honestly.
Start with industry benchmarks. Actuarial organizations publish loss development patterns by line of business. These are built on industry-wide data, so they have the volume your book lacks. Use them as a sanity check. If your factors diverge dramatically from industry, you need a good explanation—either your book is genuinely different, or your data is unreliable.
Be honest about credibility. When your data is thin, blend it with external data. Give your own experience partial weight and industry benchmarks the rest. How much weight depends on your volume—more claims means more credibility to your own data. This is standard actuarial practice, and it prevents you from over-relying on factors that aren’t stable.
Segment thoughtfully. If you have enough volume, build separate triangles for lines or segments with different development characteristics. If you don’t have enough volume, recognize that your combined triangle is a compromise and interpret it accordingly.
Understand your claims process. The best way to interpret development is to know what’s happening in your claims. Talk to your adjusters. Understand reserve-setting practices. Know which claims are in litigation and why. The triangle is just a summary—the claims file is where the actual information lives.
Don’t over-engineer the projections. More sophisticated reserving methods exist, but they don’t fix bad data. A simple approach on good data beats a complex approach on garbage. Focus on data quality and process understanding before upgrading your methodology.
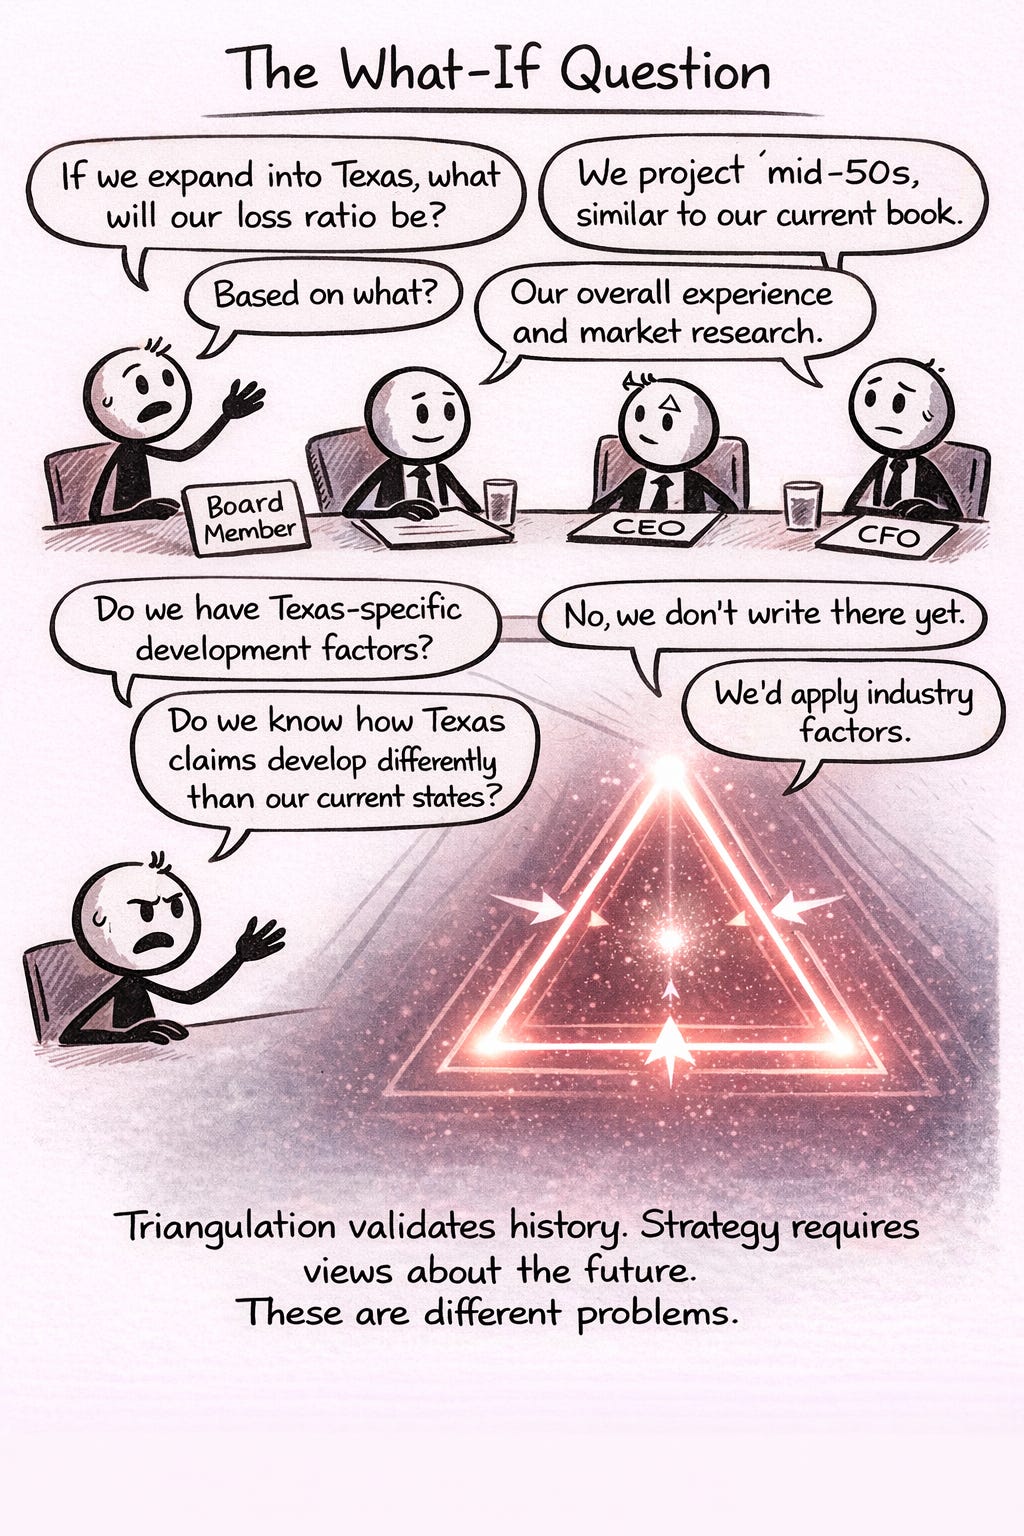
The shift is asking different questions. Instead of “do these numbers match what I expected?” ask “what assumptions does this factor rely on?” and “what would make it wrong?”

When Triangles Actually Help
This isn’t all doom. Triangles earn their place when the conditions are right.
Enough volume means development factors stabilize. What counts as “enough” depends on the line—long-tailed lines need more data—but generally, you typically need enough claim count and stable mix that a few claims don’t swing the factors
Enough history means you’ve observed losses through their full development cycle. If your line takes five years to mature, three years of data isn’t enough. You haven’t seen the finish line yet.
Stable composition means you’re comparing like to like. The book you wrote in 2021 should resemble the book you wrote in 2023. If not, historical factors don’t transfer.
Even when conditions aren’t perfect, the discipline of building triangles has value. It forces you to organize your data, look at development, and ask questions about why losses are moving. The output might not be precise, but the process builds understanding.
The goal isn’t to get triangles perfect. It’s to know what they’re actually telling you—and what they’re not. A development factor isn’t an answer. It’s a starting point for asking better questions about your book.
The trap is thinking the math does the thinking for you. It doesn’t. The judgment is still yours.

Interesting … in 1972 was when the Bornheutter Ferguson was born …